Kornia 0.6 : Tutorials (中級) : SOLD2 によるライン検出とマッチング:自己教師ありオクルージョン-aware なライン記述と検出 (翻訳/解説)
翻訳 : (株)クラスキャット セールスインフォメーション
作成日時 : 10/28/2022 (v0.6.8)
* 本ページは、Kornia Tutorials の以下のドキュメントを翻訳した上で適宜、補足説明したものです:
- Intermediate : Line detection and matching example with SOLD2: Self-supervised Occlusion-aware Line Description and Detection
* サンプルコードの動作確認はしておりますが、必要な場合には適宜、追加改変しています。
* ご自由にリンクを張って頂いてかまいませんが、sales-info@classcat.com までご一報いただけると嬉しいです。
クラスキャット 人工知能 研究開発支援サービス
◆ クラスキャット は人工知能・テレワークに関する各種サービスを提供しています。お気軽にご相談ください :

- 人工知能研究開発支援
- 人工知能研修サービス(経営者層向けオンサイト研修)
- テクニカルコンサルティングサービス
- 実証実験(プロトタイプ構築)
- アプリケーションへの実装
- 人工知能研修サービス
- PoC(概念実証)を失敗させないための支援
◆ 人工知能とビジネスをテーマに WEB セミナーを定期的に開催しています。スケジュール。
- お住まいの地域に関係なく Web ブラウザからご参加頂けます。事前登録 が必要ですのでご注意ください。
◆ お問合せ : 本件に関するお問い合わせ先は下記までお願いいたします。
- 株式会社クラスキャット セールス・マーケティング本部 セールス・インフォメーション
- sales-info@classcat.com ; Web: www.classcat.com ; ClassCatJP
Kornia 0.6 : Tutorials (中級) : SOLD2 によるライン検出とマッチング:自己教師ありオクルージョン-aware なライン記述と検出
このチュートリアルでは、kornia.feature.sold2 API を使用してライン検出、そしてマッチングを素早く実行できる方法を示します。
セットアップ
ライブラリをインストールします :
%%capture
!pip install git+https://github.com/kornia/kornia
!pip install opencv-python --upgrade # Just for windows
!pip install matplotlib
次に画像をダウンロードします :
%%capture
!wget https://github.com/cvg/SOLD2/raw/main/assets/images/terrace0.JPG
!wget https://github.com/cvg/SOLD2/raw/main/assets/images/terrace1.JPG
そして、ライブラリをロードします :
import kornia as K
import kornia.feature as KF
import torch
/home/docs/checkouts/readthedocs.org/user_builds/kornia-tutorials/envs/latest/lib/python3.7/site-packages/tqdm/auto.py:22: TqdmWarning: IProgress not found. Please update jupyter and ipywidgets. See https://ipywidgets.readthedocs.io/en/stable/user_install.html
  from .autonotebook import tqdm as notebook_tqdm
画像をロードして torch テンソルに変換します。
def load_img(img_path):
    try:
        # not ready on Windows machine
        img = K.io.load_image(img_path, K.io.ImageLoadType.RGB32)
    except:
        import cv2

        img = cv2.imread(img_path, cv2.IMREAD_COLOR)
        img = cv2.cvtColor(img, cv2.COLOR_BGR2RGB)
        img = K.image_to_tensor(img).float() / 255.0
    return img
fname1 = "terrace0.JPG"
fname2 = "terrace1.JPG"

torch_img1 = load_img(fname1)
torch_img2 = load_img(fname2)

torch_img1.shape, torch_img2.shape
(torch.Size([3, 496, 744]), torch.Size([3, 496, 744]))
モデル用にデータを準備します、これはグレースケール (shape: (Batch size, 1, Height, Width)) の画像のバッチが想定されます。
SOLD2 モデルは config=None を使用するとき範囲 400~800px の画像に対して調整されました。
# First, convert the images to gray scale
torch_img1_gray = K.color.rgb_to_grayscale(torch_img1)
torch_img2_gray = K.color.rgb_to_grayscale(torch_img2)
torch_img1_gray.shape, torch_img2_gray.shape
(torch.Size([1, 496, 744]), torch.Size([1, 496, 744]))
# then, stack the images to create/simulate a batch
imgs = torch.stack(
    [torch_img1_gray, torch_img2_gray],
)

imgs.shape
torch.Size([2, 1, 496, 744])
ライン検出とマッチングの実行
sold2 モデルを pre-trained=True でロードします、これは事前訓練済み重みをダウンロードしてモデルに設定します。
%%capture
sold2 = KF.SOLD2(pretrained=True, config=None)
モデル予測の実行
%%capture
with torch.inference_mode():
    outputs = sold2(imgs)
デモ用の出力を体系化します。
Attention : 検出された線分は慣習で ij 座標にあります。
outputs.keys()
dict_keys(['junction_heatmap', 'line_heatmap', 'dense_desc', 'line_segments'])
line_seg1 = outputs["line_segments"][0]
line_seg2 = outputs["line_segments"][1]
desc1 = outputs["dense_desc"][0]
desc2 = outputs["dense_desc"][1]
ライン・マッチングの実行
with torch.inference_mode():
    matches = sold2.match(line_seg1, line_seg2, desc1[None], desc2[None])
valid_matches = matches != -1
match_indices = matches[valid_matches]

matched_lines1 = line_seg1[valid_matches]
matched_lines2 = line_seg2[match_indices]
検出されたラインとマッチングのプロット
元のコード から適応されたプロット関数 :
import copy

import matplotlib
import matplotlib.colors as mcolors
import matplotlib.pyplot as plt
import numpy as np


def plot_images(imgs, titles=None, cmaps="gray", dpi=100, size=6, pad=0.5):
    """Plot a set of images horizontally.
    Args:
        imgs: a list of NumPy or PyTorch images, RGB (H, W, 3) or mono (H, W).
        titles: a list of strings, as titles for each image.
        cmaps: colormaps for monochrome images.
    """
    n = len(imgs)
    if not isinstance(cmaps, (list, tuple)):
        cmaps = [cmaps] * n
    figsize = (size * n, size * 3 / 4) if size is not None else None
    fig, ax = plt.subplots(1, n, figsize=figsize, dpi=dpi)
    if n == 1:
        ax = [ax]
    for i in range(n):
        ax[i].imshow(imgs[i], cmap=plt.get_cmap(cmaps[i]))
        ax[i].get_yaxis().set_ticks([])
        ax[i].get_xaxis().set_ticks([])
        ax[i].set_axis_off()
        for spine in ax[i].spines.values():  # remove frame
            spine.set_visible(False)
        if titles:
            ax[i].set_title(titles[i])
    fig.tight_layout(pad=pad)


def plot_lines(
    lines, line_colors="orange", point_colors="cyan", ps=4, lw=2, indices=(0, 1)
):
    """Plot lines and endpoints for existing images.
    Args:
        lines: list of ndarrays of size (N, 2, 2).
        colors: string, or list of list of tuples (one for each keypoints).
        ps: size of the keypoints as float pixels.
        lw: line width as float pixels.
        indices: indices of the images to draw the matches on.
    """
    if not isinstance(line_colors, list):
        line_colors = [line_colors] * len(lines)
    if not isinstance(point_colors, list):
        point_colors = [point_colors] * len(lines)

    fig = plt.gcf()
    ax = fig.axes
    assert len(ax) > max(indices)
    axes = [ax[i] for i in indices]
    fig.canvas.draw()

    # Plot the lines and junctions
    for a, l, lc, pc in zip(axes, lines, line_colors, point_colors):
        for i in range(len(l)):
            line = matplotlib.lines.Line2D(
                (l[i, 1, 1], l[i, 0, 1]),
                (l[i, 1, 0], l[i, 0, 0]),
                zorder=1,
                c=lc,
                linewidth=lw,
            )
            a.add_line(line)
        pts = l.reshape(-1, 2)
        a.scatter(pts[:, 1], pts[:, 0], c=pc, s=ps, linewidths=0, zorder=2)


def plot_color_line_matches(lines, lw=2, indices=(0, 1)):
    """Plot line matches for existing images with multiple colors.
    Args:
        lines: list of ndarrays of size (N, 2, 2).
        lw: line width as float pixels.
        indices: indices of the images to draw the matches on.
    """
    n_lines = len(lines[0])

    cmap = plt.get_cmap("nipy_spectral", lut=n_lines)
    colors = np.array([mcolors.rgb2hex(cmap(i)) for i in range(cmap.N)])

    np.random.shuffle(colors)

    fig = plt.gcf()
    ax = fig.axes
    assert len(ax) > max(indices)
    axes = [ax[i] for i in indices]
    fig.canvas.draw()

    # Plot the lines
    for a, l in zip(axes, lines):
        for i in range(len(l)):
            line = matplotlib.lines.Line2D(
                (l[i, 1, 1], l[i, 0, 1]),
                (l[i, 1, 0], l[i, 0, 0]),
                zorder=1,
                c=colors[i],
                linewidth=lw,
            )
            a.add_line(line)
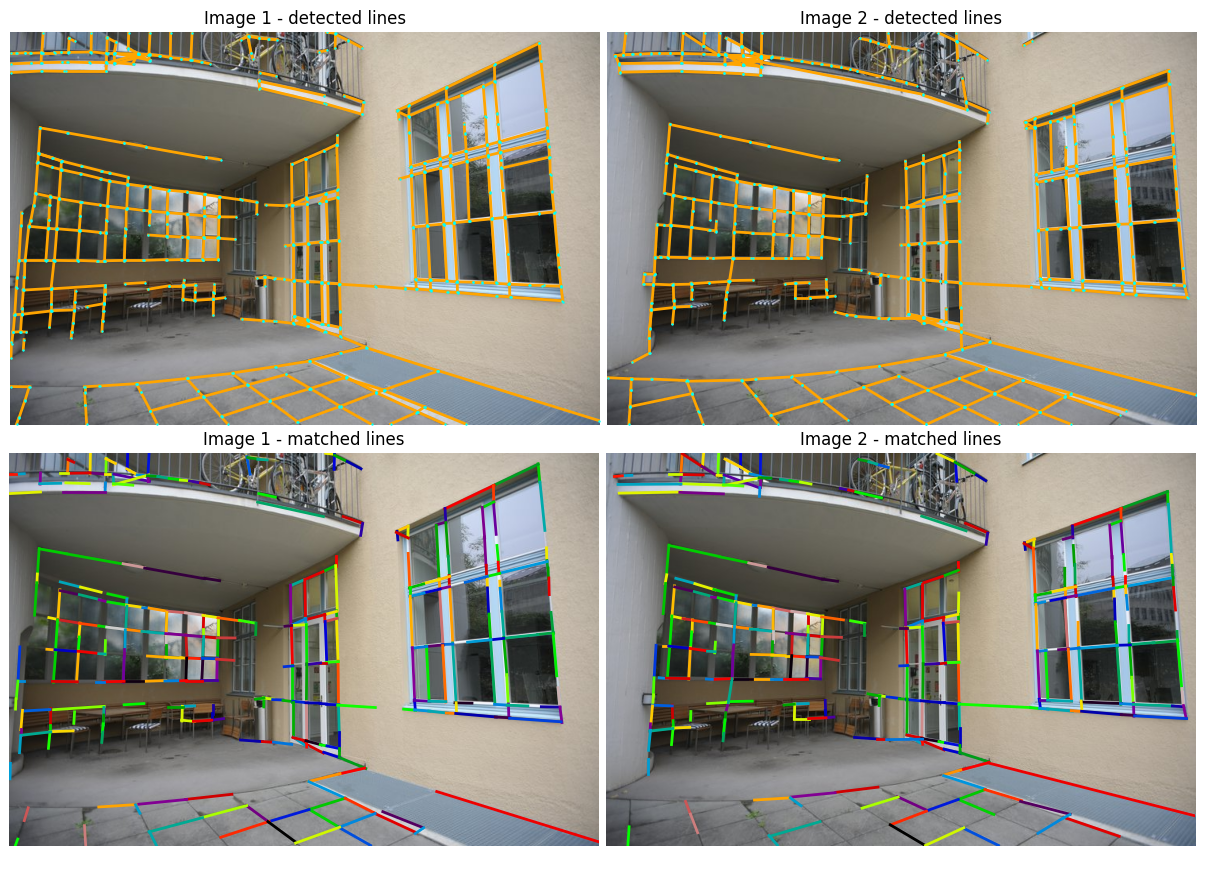
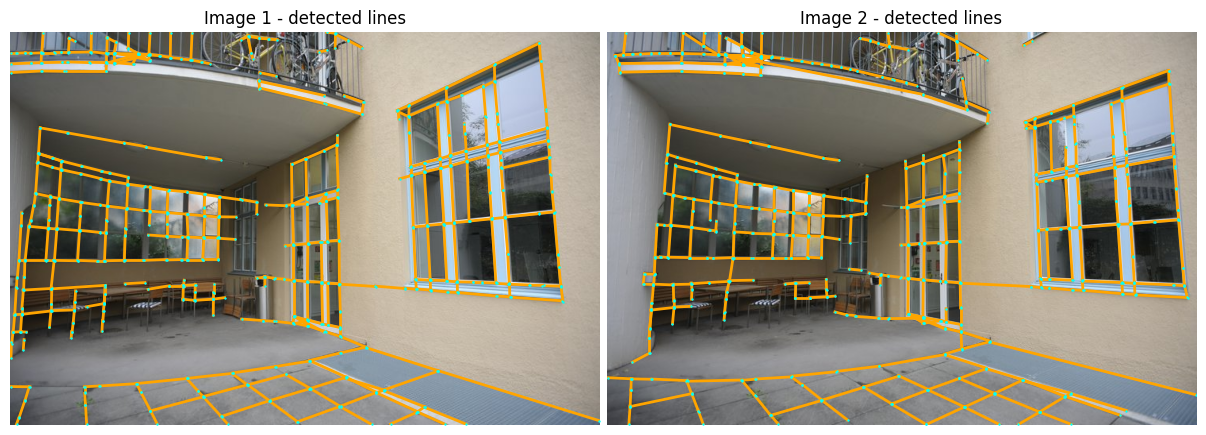
imgs_to_plot = [K.tensor_to_image(torch_img1), K.tensor_to_image(torch_img2)]
lines_to_plot = [line_seg1.numpy(), line_seg2.numpy()]

plot_images(imgs_to_plot, ["Image 1 - detected lines", "Image 2 - detected lines"])
plot_lines(lines_to_plot, ps=3, lw=2, indices={0, 1})
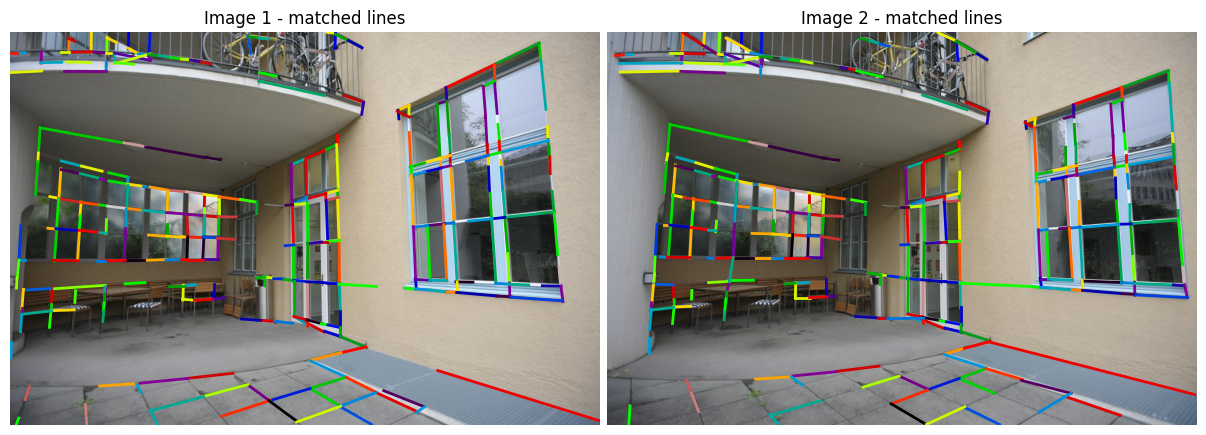
plot_images(imgs_to_plot, ["Image 1 - matched lines", "Image 2 - matched lines"])
plot_color_line_matches([matched_lines1, matched_lines2], lw=2)
以上