Kornia 0.6 : Tutorials (中級) : 幾何学的な画像と点の変換 (翻訳/解説)
翻訳 : (株)クラスキャット セールスインフォメーション
作成日時 : 10/28/2022 (v0.6.8)
* 本ページは、Kornia Tutorials の以下のドキュメントを翻訳した上で適宜、補足説明したものです:
- Intermediate : Geometric image and points transformations
* サンプルコードの動作確認はしておりますが、必要な場合には適宜、追加改変しています。
* ご自由にリンクを張って頂いてかまいませんが、sales-info@classcat.com までご一報いただけると嬉しいです。

- 人工知能研究開発支援
- 人工知能研修サービス(経営者層向けオンサイト研修)
- テクニカルコンサルティングサービス
- 実証実験(プロトタイプ構築)
- アプリケーションへの実装
- 人工知能研修サービス
- PoC(概念実証)を失敗させないための支援
- お住まいの地域に関係なく Web ブラウザからご参加頂けます。事前登録 が必要ですのでご注意ください。
◆ お問合せ : 本件に関するお問い合わせ先は下記までお願いいたします。
- 株式会社クラスキャット セールス・マーケティング本部 セールス・インフォメーション
- sales-info@classcat.com ; Web: www.classcat.com ; ClassCatJP

Kornia 0.6 : Tutorials (中級) : 幾何学的な画像と点の変換
このチュートリアルでは、幾何学的に合成画像を生成して操作し、2D ポイントを操作するために変換を使用する方法、そしてデータ増強を実行するために torch コンポーネントと組み合わせる方法を学習します。

幾何学的変換 API は torchvision に準拠し、ユーザにオリジナル (画像) に適用された変換を返すフラグ return_transform のような幾つかの追加機能 (= extra) を含みます。
加えて、API は nn.Module から継承していて、これは nn.Sequential と組み合わせて、この最後のものが使用されたときに様々な適用された変換と連鎖できることを意味します。更に、CPU/GPU (そして将来的には TPU) のような様々なデバイスを使用して画像のバッチ內で計算することができます。
最後に、すべての演算子は完全に微分可能で、ユーザがこの特徴を利用できるように今後のチュートリアルでトピックをカバーします。
簡潔に言えば、このチュートリアルで以下の方法を学習します :
- ランダムビューを生成して変換 (結果) を取得するために kornia.augmentation.RandomAffine を使用する。
- ビュー間のポイントを操作するために kornia.geometry.transform_points を使用する。
- 完全な増強パイプラインを生成するために nn.Module 內で上記を他の kornia.augmenation コンポーネントと組み合わせる。
インストール
最初に Kornia v0.2.0 と可視化のための Matplotlib をインストールします。
データで遊ぶために HPatches データセット [1] からの幾つかのサンプルを使用します。
[1] HPatches: A benchmark and evaluation of handcrafted and learned local descriptors, Vassileios Balntas*, Karel Lenc*, Andrea Vedaldi and Krystian Mikolajczyk, CVPR 2017.
%%capture
!pip install kornia matplotlib
%%capture
# download from: https://github.com/kornia/data
!wget https://github.com/kornia/data/raw/main/homography/img1.ppm
!wget https://github.com/kornia/data/raw/main/v_dogman.ppm
!wget https://github.com/kornia/data/raw/main/v_maskedman.ppm
!wget "https://miro.medium.com/max/6064/1*Fl89R-emhz-OLH9OZIQKUg.png" -O delorean.png
セットアップ
必要なライブラリをインストールして OpenCV I/O を利用するために小さな機能を作成します。
%matplotlib inline
import matplotlib.pyplot as plt

import kornia as K

import cv2
import numpy as np

import torch
import torch.nn as nn
/home/docs/checkouts/readthedocs.org/user_builds/kornia-tutorials/envs/latest/lib/python3.7/site-packages/tqdm/auto.py:22: TqdmWarning: IProgress not found. Please update jupyter and ipywidgets. See https://ipywidgets.readthedocs.io/en/stable/user_install.html
  from .autonotebook import tqdm as notebook_tqdm
OpenCV を使用して画像をロードして torch.Tensor にキャストする、任意の kornia 演算子により使用される汎用関数を定義します。
def imread(data_path: str) -> torch.Tensor:
    """Utility function that load an image an convert to torch."""
    # open image using OpenCV (HxWxC)
    img: np.ndarray = cv2.imread(data_path, cv2.IMREAD_COLOR)

    # cast image to torch tensor and convert to RGB
    img_t: torch.Tensor = K.utils.image_to_tensor(img, keepdim=False)  # BxCxHxW
    img_t = K.color.bgr_to_rgb(img_t)

    return img_t.float() / 255.
Matplotlib を使用する可視化用の関数を定義します。
def imshow(image: np.ndarray, height: int, width: int):
    """Utility function to plot images."""
    plt.figure(figsize=(height, width))
    plt.imshow(image)
    plt.axis('off')
    plt.show()
Kornia はレンダリング機能を提供していませんので、ポイントを描画するために OpenCV cv2.circle を使用しましょう。
def draw_points(img_t: torch.Tensor, points: torch.Tensor) -> np.ndarray:
    """Utility function to draw a set of points in an image."""

    # cast image to numpy (HxWxC)
    img: np.ndarray = K.utils.tensor_to_image(img_t)

    # using cv2.circle() method
    # draw a circle with blue line borders of thickness of 2 px
    img_out: np.ndarray = img.copy()

    for pt in points:
        x, y = int(pt[0]), int(pt[1])
        img_out = cv2.circle(
            img_out, (x, y), radius=10, color=(0, 0, 255), thickness=5
        )
    return np.clip(img_out, 0, 1)
単一画像の変換
このセクションでは、単一画像をオープンし、2d ランダムポイントを生成し、そして OpenCV と Matplotlib を使用してそれらをプロットする方法を示します。
次に、与えられた画像のランダムな合成ビューを生成するために kornia.augmentation.RandomAffine を使用し、画像間のポイントを変換するために後で使用される生成された変換 (結果) を取得する方法を示します。
# load original image
img1: torch.Tensor = imread('img1.ppm')

# generate N random points within the image
N: int = 10   # the number of points
B, CH, H, W = img1.shape

points1: torch.Tensor = torch.rand(1, N, 2)
points1[..., 0] *= W
points1[..., 1] *= H

# draw points and show
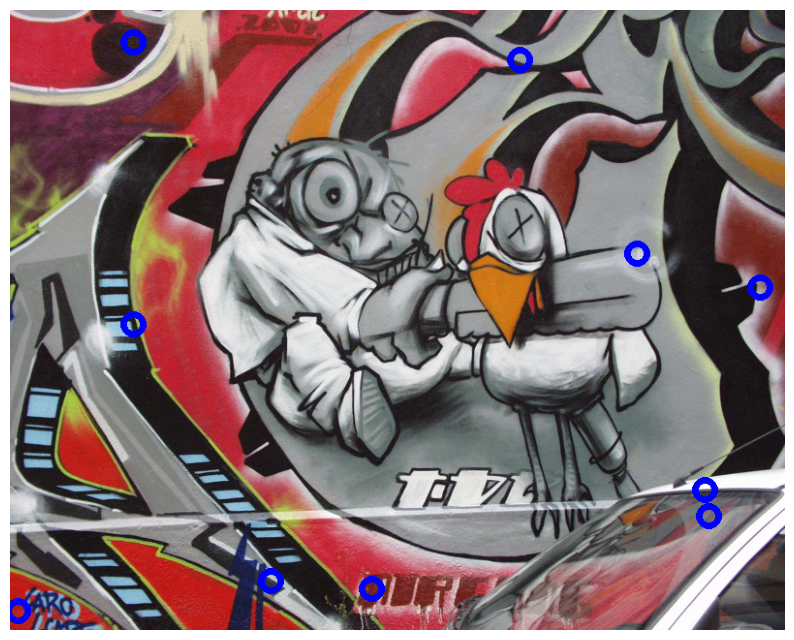
img1_vis: np.ndarray = draw_points(img1[0], points1[0])

imshow(img1_vis, 10, 10)

少し複雑な例に移り、画像を変換して適用された変換を取得するために kornia.augmentation API を使用することから始めましょう。画像間の 2d ポイントを射影するためにこの変換を再利用する方法を示します。
# declare an instance of our random affine generation eith `return_transform`
# set to True, so that we recieve a tuple with the transformed image and the
# transformation applied to the original image.
transform: nn.Module = K.augmentation.RandomAffine(
    degrees=[-45., 45.], return_transform=True, p=1.
)

# tranform image and retrieve transformation
img2, trans = transform(img1)

# transform the original points
points2: torch.Tensor = K.geometry.transform_points(trans, points1)

# visualize both images
img2_vis: np.ndarray = draw_points(img2, points2[0])

img_vis = np.concatenate([img1_vis, img2_vis], axis=1)

imshow(img_vis, 15, 15)
画像のバッチの変換
イントロダクションで、kornia.augmentation が nn.Module と nn.Sequential のような他の torch コンポーネントと統合される機能について說明しました。
画像とポイントを変換するための前に示されたのと同じアイデアを再利用して、バッチ化された画像上でデータ増強を実行する小さいコンポーネントを作成します。
まず、kornia.augmentation.ColorJitter と kornia.augmentation.RandomAffine コンポーネントを使用して、小さいカラー増強を伴う合成ビューのサンプルを生成するクラスを定義しましょう。
Note : メモリ効率的にするために forward パスをデコレータ @torch.no_grad() により勾配を持たないように設定します。
from typing import Dict

class DataAugmentator(nn.Module):
    def __init__(self) -> None:
        super().__init__()
        # declare kornia components as class members
        self.k1 = K.augmentation.RandomAffine([-60, 60], return_transform=True, p=1.)
        self.k2 = K.augmentation.ColorJitter(0.5, 0.5, p=1.)

    @torch.no_grad()
    def forward(self, img1: torch.Tensor, pts1: torch.Tensor) -> Dict[str, torch.Tensor]:
        assert len(img1.shape) == 4, img1.shape

        # apply geometric transform the transform matrix
        img2, trans = self.k1(img1)

        # apply color transform
        img1, img2 = self.k2(img1), self.k2(img2)

        # finally, lets use the transform to project the points
        pts2: torch.Tensor = K.geometry.transform_points(trans, pts1)

        return dict(img1=img1, img2=img2, pts1=pts1, pts2=pts2)
定義済みコンポーネントを使用して幾つかの合成データを生成します!
# load data and make a batch
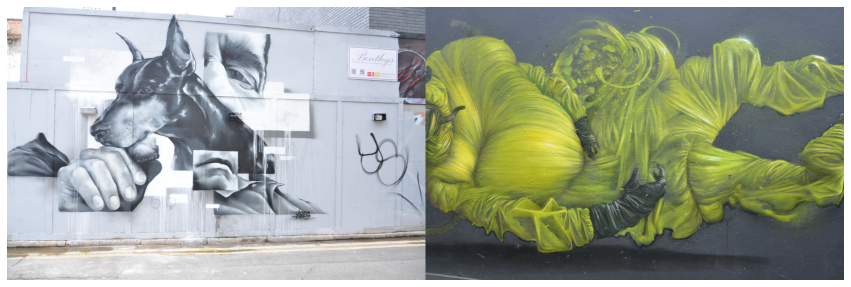
img1: torch.Tensor = imread('v_dogman.ppm')
img2: torch.Tensor = imread('v_maskedman.ppm')

# crop data to make it homogeneous
crop = K.augmentation.CenterCrop((512, 786))

img1, img2 = crop(img1), crop(img2)

# visualize
img_vis = torch.cat([img1, img2], dim=-1)
imshow(K.tensor_to_image(img_vis), 15, 15)
/usr/local/lib/python3.7/dist-packages/kornia/utils/helpers.py:96: UserWarning: torch.solve is deprecated in favor of torch.linalg.solveand will be removed in a future PyTorch release.
torch.linalg.solve has its arguments reversed and does not return the LU factorization.
To get the LU factorization see torch.lu, which can be used with torch.lu_solve or torch.lu_unpack.
X = torch.solve(B, A).solution
should be replaced with
X = torch.linalg.solve(A, B) (Triggered internally at  /pytorch/aten/src/ATen/native/BatchLinearAlgebra.cpp:760.)
  out1, out2 = torch.solve(input.to(dtype), A.to(dtype))

# create an instance of the augmentation pipeline
# NOTE: remember that this is a nn.Module and could be
# placed inside any network, pytorch-lighting module, etc.
aug: nn.Module = DataAugmentator()

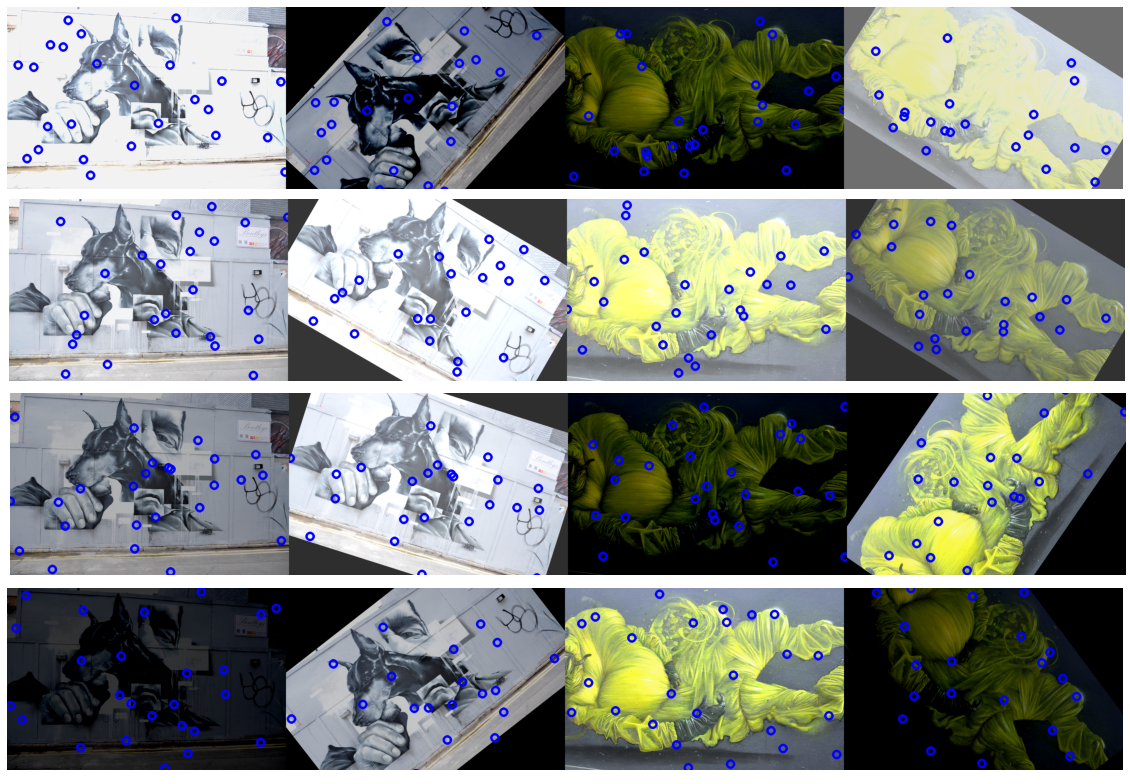
for _ in range(5):  # create some samples

    # generate batch
    img_batch = torch.cat([img1, img2], dim=0)

    # generate random points (or from a network)
    N: int = 25
    B, CH, H, W = img_batch.shape

    points: torch.Tensor = torch.rand(B, N, 2)
    points[..., 0] *= W
    points[..., 1] *= H

    # sample data
    batch_data = aug(img_batch, points)

    # plot and show
    # visualize both images

    img_vis_list = []

    for i in range(2):
        img1_vis: np.ndarray = draw_points(
            batch_data['img1'][i], batch_data['pts1'][i]
        )
        img_vis_list.append(img1_vis)

        img2_vis: np.ndarray = draw_points(
            batch_data['img2'][i], batch_data['pts2'][i]
        )
        img_vis_list.append(img2_vis)

    img_vis = np.concatenate(img_vis_list, axis=1)

    imshow(img_vis, 20, 20)


以上